基于大数据的消费者能力的数据可视化平台设计与实现 毕业论文+任务书+开题报告+开题答辩PPT+项目源码及数据库文件
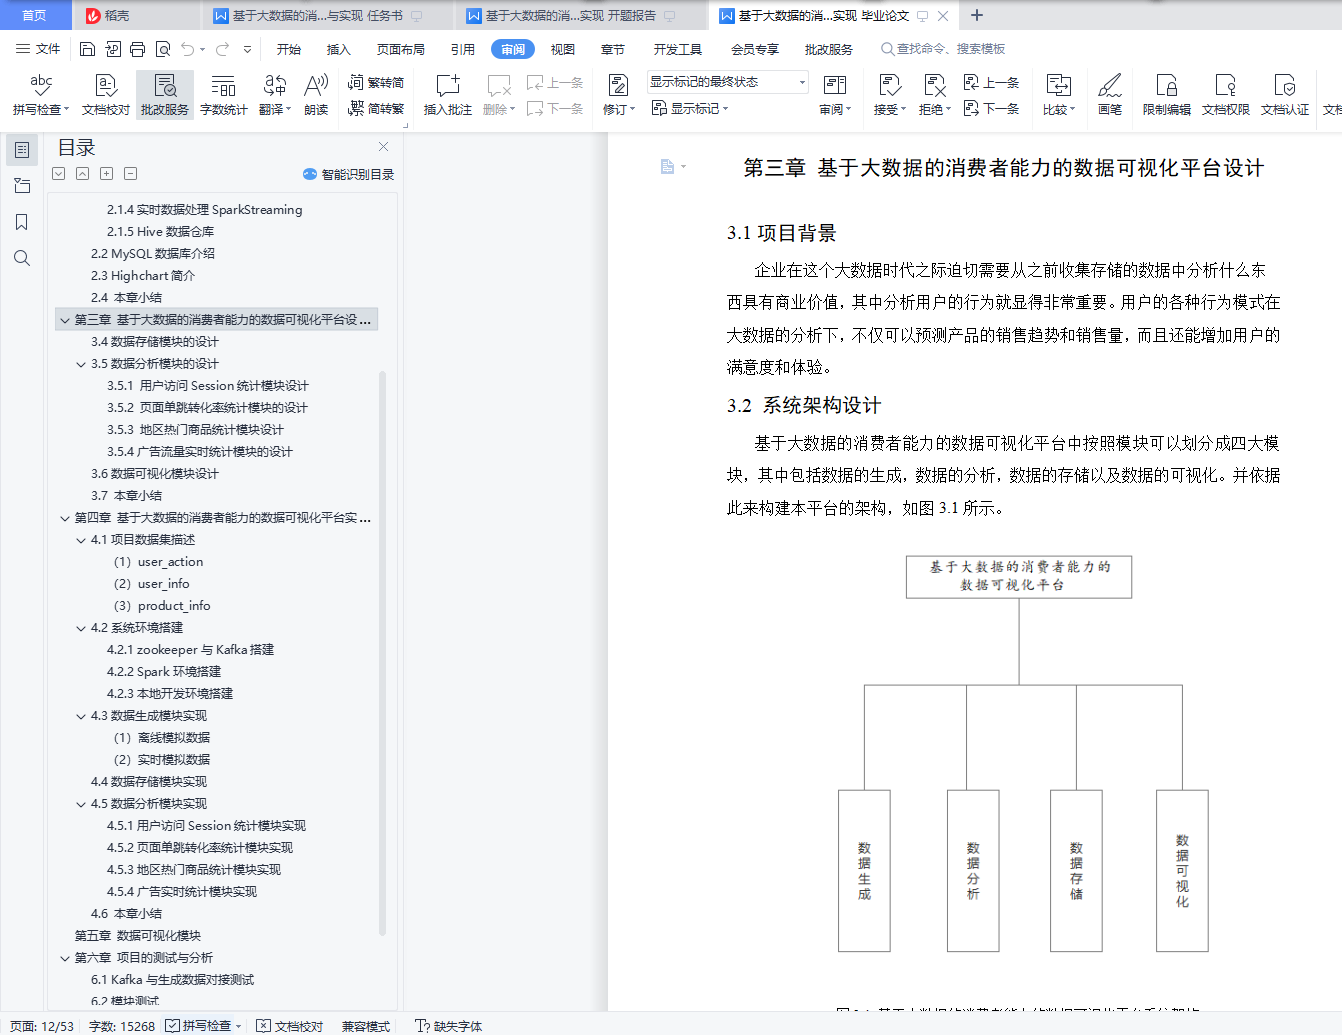
基于大数据的消费者能力的数据可视化平台设计与实现摘 要大数据时代的来临,为了提高企业核心竞争力,首先需要解决电子商务大数据领域中,本设计主要为解决商家无法找到精准客户的问题,通过科学的方式对目标市场中形态各异的消费者进行精细的划分,根据每个用户不同的消费习惯以及行为特征等信息,采用现代信息技术的手段和方法,指向明确的营销策略,实现对目标市场中不同消费者群体更加精准高效的营销方式。通过开发设计大数据可视化平台,实现商品对消费者的精准推荐,主要是对用户购买商品的记录做采集,用户当然是越多推荐结果也就越准确。然后我们对数据做数据挖掘,自己写推荐算法,找出商品与商品之间的亲密度,等用户再次登录的时候,会根据他购买过的商品,为他做出推荐,为他推荐出他可能喜欢的商品。消费者能力的数据可视化平台采用SparkCore+SparkSQL+SparkStreaming的大数据分析技术,并用MySQL作为数据库存储数据。本平台主要包括数据生成、数据分析、数据存储和数据可视化四个模块。通过电商数据平台对海量数据的分析,筛选出具有商业价值的数据,并利用可视化网站直观地呈现数据,辅助企业调整战略和业务,促进企业的发展。关键词:大数据;电商;消费者;数据分析;可视化Design and implementation of a data visualization platform for consumer capabilities based on big dataAbstractBig data era, in order to improve the core competitiveness, first need to solve the field of e-commerce big data, this design mainly to solve the problem of merchants cannot find accurate customers, through the scientific way of different consumers, according to each user's different consumption habits and behavior characteristics of information, using modern information technology means and methods, pointing to a clear marketing strategy, to achieve different consumer groups in the target market more accurate and efficient marketing methods.Through the development and design of a big data visualization platform, the accurate recommendation of goods to consumers is mainly to collect the records of users' goods purchases. Of course, the more users recommend, the more accurate the recommendation results are.Then we do data mining on the data, write the recommendation algorithm by ourselves, and find out the affinity between the goods. When the user will log in again, we will make recommendations for him according to the goods he has bought, and recommend the goods he may like for him.The consumer power data visualization platform uses the big data analysis technology of SparkCore + SparkSQL + SparkStreaming, and stores the data with MySQL as a database.The platform mainly includes four modules: data generation, data analysis, data storage and data visualization.Through the analysis of massive data by the e-commerce data platform, the data with commercial value is selected, and the visual website is used to visually present the data to assist enterprises to adjust their strategy and business and promote the development of enterprises.Key words: big data; e-commerce; consumer; data analysis; visualization目 录摘 要 IAbstract II第一章 绪论 11.1项目背景和意义 11.2项目研究内容 11.3论文组织架构 2第二章 相关技术介绍 32.1大数据技术介绍 32.1.1 Spark简介 32.1.2 弹性分布式数据集RDD 32.1.3数据处理模块SparkSQL 42.1.4实时数据处理SparkStreaming 42.1.5 Hive数据仓库 52.2 MySQL数据库介绍 52.3 Highchart简介 62.4 本章小结 6第三章 基于大数据的消费者能力的数据可视化平台设计 73.1项目背景 73.2 系统架构设计 73.3 数据生成模块的设计 83.4数据存储模块的设计 83.5数据分析模块的设计 83.5.1 用户访问Session统计模块设计 83.5.2 页面单跳转化率统计模块的设计 83.5.3 地区热门商品统计模块设计 93.5.4广告流量实时统计模块的设计 93.6数据可视化模块设计 93.7 本章小结 9第四章 基于大数据的消费者能力的数据可视化平台实现 104.1项目数据集描述 10(1)user_action 10(2)user_info 11(3)product_info 114.2系统环境搭建 124.2.1 zookeeper与Kafka搭建 124.2.2 Spark环境搭建 134.2.3本地开发环境搭建 144.3数据生成模块实现 14(1) 离线模拟数据 14(2)实时模拟数据 144.4数据存储模块实现 144.5数据分析模块实现 184.5.1用户访问Session统计模块实现 184.5.2页面单跳转化率统计模块实现 224.5.3地区热门商品统计模块实现 234.5.4广告实时统计模块实现 244.6 本章小结 29第五章 数据可视化模块 30第六章 项目的测试与分析 416.1 Kafka与生成数据对接测试 416.2模块测试 426.3本章小结 44第七章 总结与展望 45参考文献 46致 谢 48